

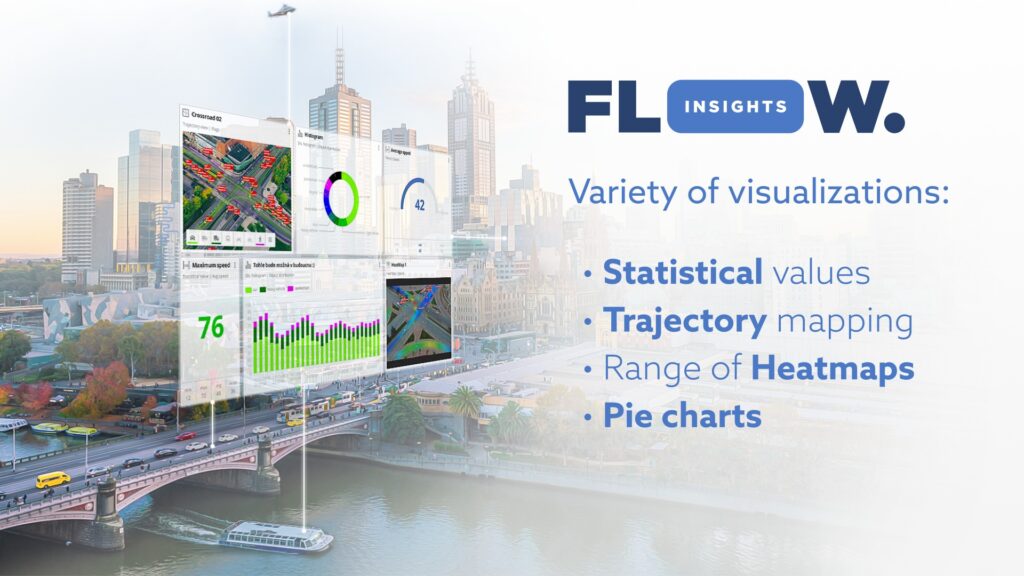
🎥🚗➡️📊📈📉 With the wide range of customizable real-time data visualizations options in the FLOW framework, traffic monitoring is a walk in the park. With FLOW you can gather a variety of traffic data such as speeds, statistical data, level of service, different traffic events, category counts, LP lists, and other advanced traffic metrics. Use can then use widgets to visualize these complex traffic data on interactive dashboards using dozens of chart types and variations, including bar charts, line charts, pie charts, tables, heatmaps, trajectory maps, and OD matrices.
We have prepared two 10-minute read guides to help you create the ideal dashboard!
Visualization of widgets’ values in charts
Using widgets to view data on the dashboard in FLOW Insights
No matter if you have an edge FLOW device such as the TrafficCamera and TrafficEmbedded, the server-side solution TrafficEnterprise or our mobile processing unit the TrafficDrone – traffic data presentation possibilities are the same. The live dashboards and their visualizations run directly on the FLOW devices and are accessible together with all the traffic data at any time you log in. What is more, you can directly download the data from many of these widgets and even save raw trajectories with the new trajectory sink functionality. Create your ultimate traffic monitoring dashboard today!
📥 Download the FLOW demo kit and design your own traffic detector with a dashboard tailored to your needs here
💭 Get in touch to connect your camera to our servers for a demo or just ask us any questions you might have here: info@datafromsky.com. You can also get in touch using the live chat on our web!