

A new function was added to DataFromSky: Traffic flow visualization. Instead of collecting vehicle counts from manually defined combinations of gates, one can now get a fully automatically generated overview of the situation. Take a look at the pictures below to compare the old and new ways:
Normal view – a tangle of trajectories

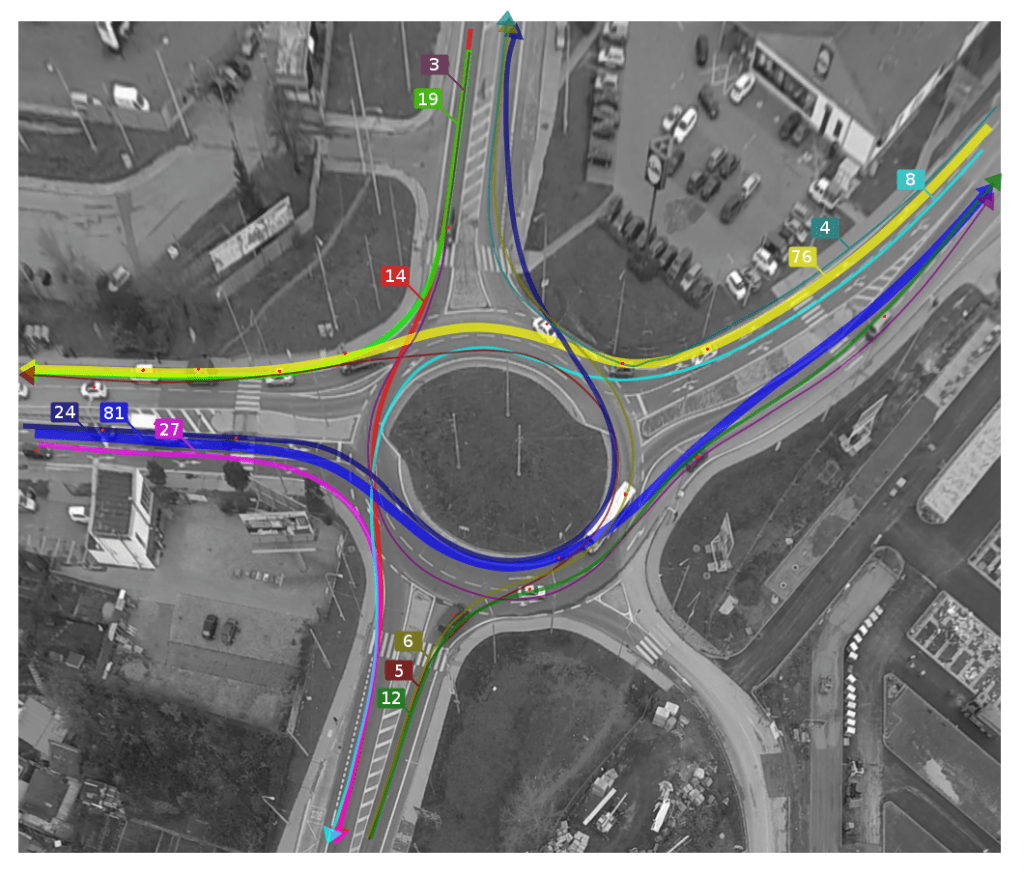
New view – trajectories’ aggregation

What happens behind the scenes is that the trajectories are grouped according to their characteristics and the resulting trajectory groups visualized according to their average. Needless to say, the DataFromSky team is pleased to bring another of computer science concepts – clustering – into practical use in the field of traffic engineering.
Of course, the trajectory clustering is again only another stepping stone on which one can build further. Even the most rudimentary statistics inside the trajectory groups allow getting at more and more interesting kinds of information. Let’s say… Automatic detection of fastest path, extracting the associated speed, time spent in roundabout etc., comparison with the rest of the group,… As always, there is much space to grow and improve. As we all know – the sky’s the limit!
As the academic year is coming to its last weeks, the DataFromSky protégés which you already heard about will boost the team shortly. So look forward to more news of this kind, and if you have an idea for a function, type of data, that can be extracted from the currently available information, we are ready to listen!