

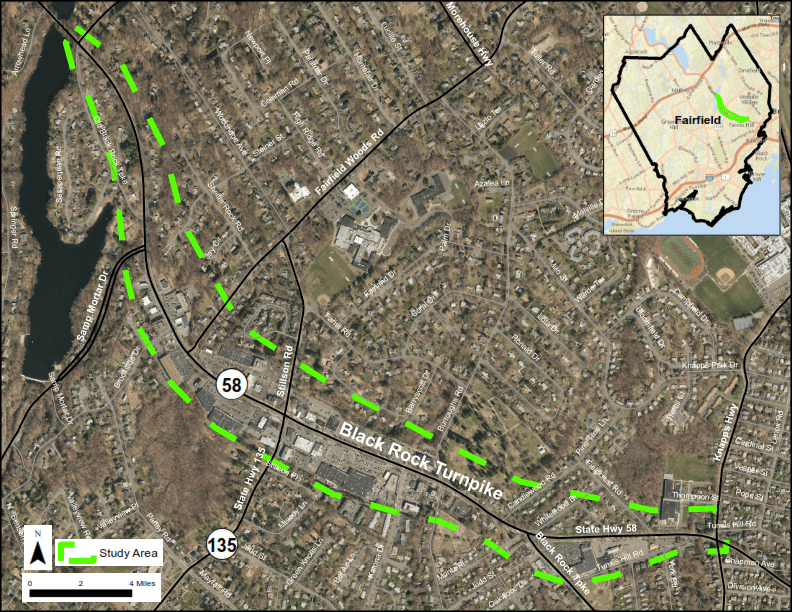
Another great project has been accomplished, among other things, thanks to DataFromSky analysis! DataFromSky has made a traffic study of a corridor in the city of Fairfield in Connecticut, U.S.. The data were used for an extensive Safety analysis of the whole corridor called Black Rock Turnpike. The study, created by The Connecticut Metropolitan Council of Governments (MetroCOG) and FHI, identifies strategies to create a safe and attractive pedestrian environment, a robust infrastructure for bicyclists, and linkages between residential areas and the shops, businesses and restaurants along Black Rock Turnpike.
Black Rock Turnpike is a major arterial that serves one of the city’s largest business and commercial districts. According to the estimates, approximately 20,000 vehicles utilize this corridor every day. As the results of the analysis show – although Black Rock Turnpike has a posted speed limit of 50 km/h (30 miles/h), the average speeds are between 55 – 65 km/h (35-40 miles/h). The road widths, speed, high traffic volume and numerous curb cuts create an unsafe and uninviting pedestrian environment. Click on this link to read more about the whole project.
However, what is truly remarkable about this analysis is the method how the data were recorded and analyzed. To be able to cover the whole corridor, which is roughly 1,3 km in length, up to 8 drones recording at the same time were needed! This allowed us to analyze the corridor as a complex scene, obtain the complete trajectories of vehicles for the whole analyzed route and create the detailed Origin-destination statistics! What were the key conditions for the successful analysis?
- top-down view position (bird’s eye perspective)
- space overlap – at least 10 % of overlap in the analyzed area from each side
- time overlap – all the drones started filming at the exact same time
Take a look at the video of raw output of 8 drone videos merged together: